Incorporating body composition changes into the lactation feed efficiency equation can provide a more complete, accurate picture of sow efficiency.
The modern sow is raising larger, heavier litters than ever before, placing greater demands on lactation performance. While increasing feed intake remains a key focus, feed intake alone doesn’t tell the whole story. When daily feed intake falls short, sows often compensate by mobilizing body reserves to meet the demands of a vigorous litter and compromise future reproductive performance.
This raises an important question: Are we measuring lactation feed efficiency (LFE) the right way? Traditional LFE, calculated as feed intake divided by litter weight gain, can paint a misleading picture because it doesn’t account for the biological reality of a sow’s body composition changing.
To explore this gap, PIC, in collaboration with Brenneman Pork and JYGA Technologies, makers of Gestal feeding systems, developed a new framework for evaluating LFE – incorporating milk energy output and sow body composition changes.1 This approach aims to deliver a more complete and accurate view of true sow efficiency while also generating early management and genetic selection implications.
Accounting for Body Catabolism
Data was collected from 899 sows (481 gilts and 418 sows) housed in a 10,000-head commercial sow farm in Iowa. The farm was equipped with Gestal Quattro Opti automated lactation feeders, with individual feed deliveries recorded daily, along with a scale to collect body weights, caliper, and ultrasound to capture body condition and composition. Changes in body weight, backfat thickness and loin depth were measured from farrowing to weaning, along with other essential sow and piglet datapoints.
A sow’s major energy inputs during lactation are her feed intake and the mobilization of body reserves. Her output is the amount of energy translated to piglet growth through milk production. Using data collected, various methods were tested to quantify energy pools and accurately represent energy efficiency. Initial equations used from NRC 2012 and Dourmad et al. 1999, 2008 estimated:2-4
- Metabolizable Energy (ME) Intake: Average Daily Feed Intake (ADFI) and ME per kg of feed
- ME for milk production: Depend on litter size and litter weight gain
- ME from Body Lipid (BL) and Body Protein (BP) mobilization: Depend on sow body weight and backfat
Using project data, estimations were compared with actual measurements to verify approach. Results indicate:
- Strong correlation between estimated BL change during lactation and measured backfat change.
- Weak correlation between estimated BP change in lactation and measured loin depth change. This likely reflects differences in body composition of modern sows, which are leaner and have less adipose tissue, compared with the females when the original equations were developed.
- Equations used to estimate body protein changes may not accurately reflect muscle tissue mobilization from modern sows.
Lactation bodyweight change was also evaluated against measured backfat and loin depth changes and showed a slightly better correlation. However, many sows gaining loin depth during lactation still lost body weight during this timeframe. This indicates body weight change alone is not a reliable estimator of body composition changes in modern females.
Representing the Missing Factor
Taking a different approach, individuals were categorized into four different groups based on milk production and catabolism (with catabolism being based on actual backfat and loin depth measurements).
Milk energy output was averaged within parity; females below average were considered low producing and above average were considered high producing. Additionally, females that maintained or gained either backfat or loin depth, or both, in lactation were considered low catabolism. Females losing both tissues were considered high catabolism. The four LFE groups were as follows:
Table 1
| Low Milk | High Milk | |
| Low Catabolism | “Selfish” Sow Not optimizing milk yield Below average milk output Maintained/gained backfat or loin depth | “Super” Sow Most desirable, highly efficient Above average milk output Maintained/gained backfat or loin depth |
| High Catabolism | “Inefficient” Sow Least desirable Below average milk output | “Martyr” Sow Milking at own expense Above average milk output Lost backfat and loin depth |
Table 2.*
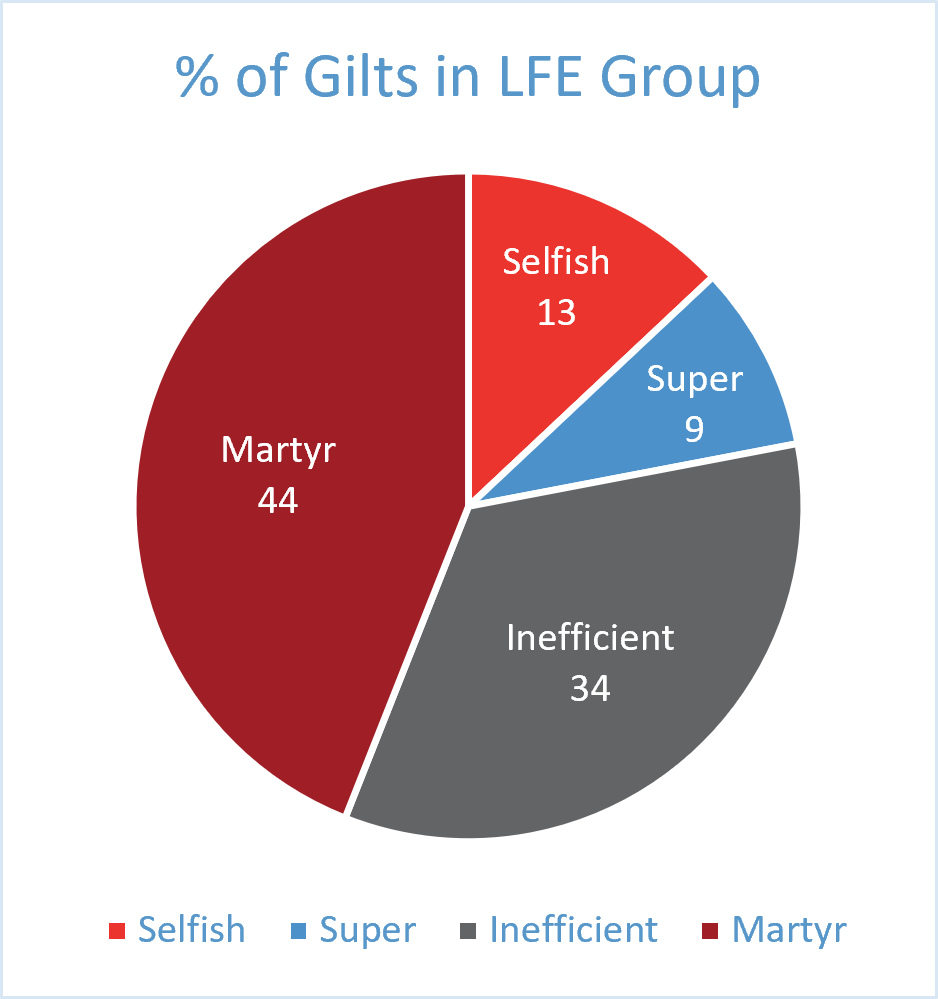
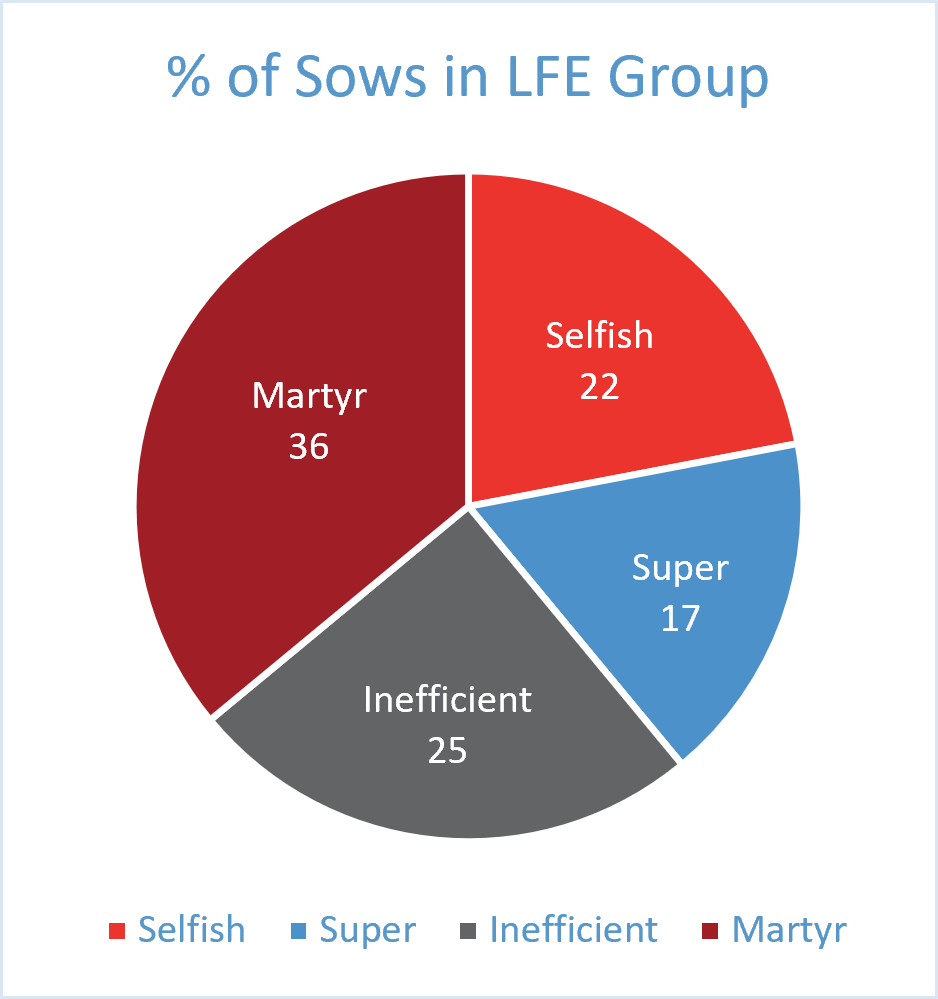
*Distributions are from an exploratory analysis of a single farm and one lactation cycle using a novel methodology that incorporates body composition. They are intended to illustrate the approach and do not represent the overall PIC sow population.
Key Data and Categorization Takeaways
Wide individual variation exists in feed intake, body composition changes and milk output, highlighting the potential for precision feed management for different sow efficiency profiles.
Using this framework, a minority of females were identified as truly efficient (9% of gilts and 17% of sows). There were fewer females in the Super category than any of the other three categories, showing room for progress.Gilts were identified as most at risk, with nearly 80% of total gilts falling into the Inefficient or Martyr categories – mobilizing their body reserves at a potential cost.
Martyr females lost significantly more weight and body tissue compared to their Inefficient and Selfish counterparts. Martyrs may have been falsely identified as “highly efficient” based on the traditional LFE calculation, without factoring in body reserve mobilization.
Both Inefficient and Selfish sows produced less litter growth even though their feed intake was not markedly low. Selfish sows preserved more body tissue while Inefficient sows mobilized their reserves, suggesting poorer overall energy utilization in the inefficient group.
Despite all categories starting with the same litter size after cross-fostering, Martyr and Super females achieved increased litter growth and piglet survival from cross-foster to weaning compared to Inefficient and Selfish counterparts.
Catabolism didn’t lead to short-term reproductive failures. There was no evidence of significant differences in subsequent reproductive performance. Longer term impacts remain unknown.
Nutrition Management and Genetic Selection Implications
While more research is needed to validate this approach to LFE and its repeatability across multiple lactation cycles, farms and nutritional programs, the short- and long-term implications are exciting. One of the shorter-term implications is refining nutrition and management.
Research done in partnership with Kansas State University has shown that gestation feeding significantly impacts lactation performance.5 Sows underfed during gestation – sows that either don’t gain weight or even lose weight from breeding to 48 hours post-farrowing – show compensatory growth during lactation at the expense of milk production. These sows start prioritizing themselves and see compensatory weight gains during lactation at a cost to milk production and the litter. This supports observations of the Selfish females and highlights the importance of evaluating performance across the full period from gestation through lactation. Additional research on feeding and nutrition management is in progress to see how we can affect the different categories.
While the new LFE category approach is still in its beginning stage, the early results and how they could shape genetics is exciting to think about. PIC is already working on a new trait for body composition looking at how body composition changes during lactation. Pairing that trait with feed intake can help deliver a fuller picture of how a sow moves resources through her body and transitions it to her litter
Longer term, learnings could be used for genetic selection of an easier to manage sow. For example, using the LFE categories, we could someday target a Super sow and identify and select for families that are genetically more prone to be in that category.
Learn more about ongoing research into sow lactation efficiency and body composition. Contact your technical service representative or the PIC Nutrition Team.
1 Veldhuizen, T., Frobose, H., Robertson, J., Higbie, L., Obermier, D., Wilson-Wells, D., Zaragoza, L. E., Spath, I. T., Hamilton, D., Altfillisch, J., Vier, C. M., & Orlando, W. A. 2026. Defining lactation feed efficiency classifications through milk production and sow body composition dynamics in modern gilts and sows. Midwest American Society of Animal Science Annual Meeting Abstract. Abstract 186.
2 National Research Council. 2012. Nutrient requirements of swine. 11th rev. ed. Washington (DC): Natl. Acad. Press.
3 Dourmad, J. Y., J. Noblet, M. C. P.re, and M. Etienne. 1999. Mating, pregnancy and prenatal growth. Pp. 129-152 in Quantitative Biology of the Pig, I. Kyriazakis, ed. Wallingford, UK: CABI.
4 Dourmad, J. Y., M. .tienne, A. Valancogne, S. Dubois, J. van Milgen, and J. Noblet. 2008. InraPorc: A model and decision support tool for the nutrition of sows. Animal Feed Science and Technology 143:372-386.
5 Navales, R., Orlando, W., Guo, J., et al. 2025. The effect of sow body weight change during gestation on sow body weight change and litter average daily gain during lactation. Kansas State University Swine Day Abstract.